
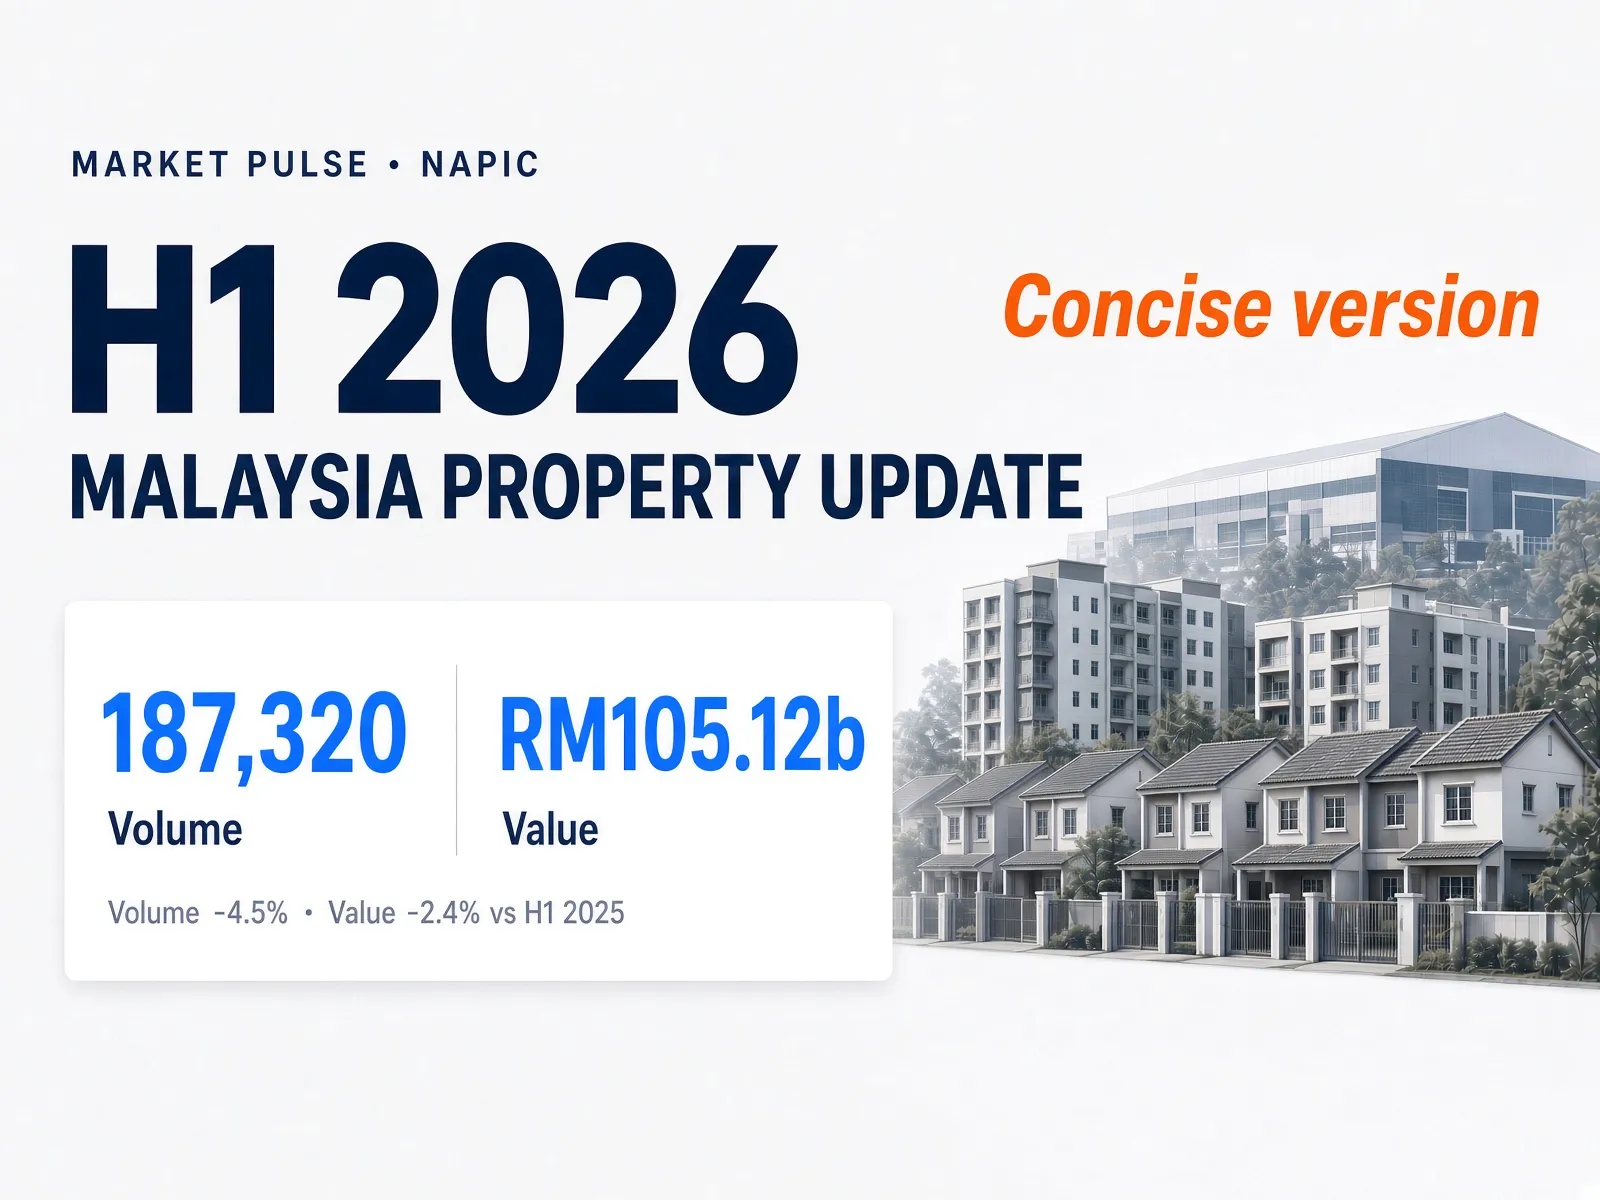
In H1 2026, Malaysia’s property market recorded a decline in both transaction and value compared to H1 2025.
Market Pulse · NAPIC H1 2026
NAPIC’s first-half 2026 property market report is out. Malaysia recorded 187,320 transactions worth RM105.12 billion. In the same half of 2025 they were 196,232 deals and RM107.68 billion. Volume is down 4.5%, and value is down 2.4%.[1][2]
That is the first H1 where both volume and value fell since the market bounced in 2022. Even so, H1 2024 was already 198,906 deals and RM105.65 billion, so the slide did not start this year. H1 2025 was a bit lighter on volume as well.[1][2]
GDP was 5.4% in the first quarter and then 6.0% in the second.[4] Meanwhile, the overnight policy rate stayed at 2.75%.[4] Budget 2026 kept the RM500,000 first-home stamp duty exemption until 31 December 2027 and lifted the SJKP housing-credit guarantee to RM20 billion.[1] Although those are the supportive lines, the numbers were down nonetheless.
National volume (transactions)
H1 2024–25H1 2026
| H1 2024 |
|
198,906 |
| H1 2025 |
|
196,232 |
| H1 2026 |
|
187,320 |
H1 2024–H1 2026. NAPIC LPH H1 2026, Charts 1–2.[1]
National value (RM billion)
H1 2024–25H1 2026
| H1 2024 |
|
105.65b |
| H1 2025 |
|
107.68b |
| H1 2026 |
|
105.12b |
Value peaked in H1 2025, then eased.[1]
The national picture
H1 2026 market share by sector
Volume
- Residential 59.3%
- Agriculture 19.8%
- Commercial 11.4%
- Dev. land 7.4%
- Industrial 2.1%
Value
- Residential 44.8%
- Commercial 23.0%
- Industrial 14.1%
- Dev. land 10.7%
- Agriculture 7.4%
Volume vs value. Overview p. 5, Charts 3–4.[1]
H1 2026 volume: residential 59.3%, agriculture 19.8%, commercial 11.4%, development land and others 7.4%, industrial 2.1%. By value the mix flips. Residential is 44.8%, commercial 23.0%, industrial 14.1%, development land and others 10.7%, agriculture 7.4%.[1] Industrial is a small slice of deals and a much larger slice of money. Agriculture is the opposite.
However, the five main sectors did not move together.[1]
- Residential: 110,998 deals, down 7.7%; RM47.11 billion, down 4.6%.
- Commercial: 21,454 deals, up 0.9%; RM24.13 billion, down 1.3%.
- Industrial: 3,932 deals, down 5.2%; RM14.78 billion, up 3.8%.
- Agriculture: 37,006 deals, down 0.7%; RM7.82 billion, down 9.4%.
- Development land: 13,918 deals, up 5.3%; RM11.23 billion, up 3.3%.
The only segments that grew volume are commercial and development land. As a result, industrial is the only large sector with rising value on falling volume, which means a higher average ticket. Agriculture is the mirror: almost the same number of deals, yet nearly a tenth less.[1]
| Sector | H1 2025 | H1 2026 | Vol |
|---|---|---|---|
| Residential | 120,307 | 110,998 | −7.7% |
| Commercial | 21,260 | 21,454 | +0.9% |
| Industrial | 4,148 | 3,932 | −5.2% |
| Agriculture | 37,283 | 37,006 | −0.7% |
| Development land | 13,220 | 13,918 | +5.3% |
| Malaysia | 196,232 | 187,320 | −4.5% |
Volume, Table III–IV. Others omitted (14 / 12 deals).[1]
| Sector | H1 2025 RM b | H1 2026 RM b | Val |
|---|---|---|---|
| Residential | 49.37 | 47.11 | −4.6% |
| Commercial | 24.45 | 24.13 | −1.3% |
| Industrial | 14.25 | 14.78 | +3.8% |
| Agriculture | 8.63 | 7.82 | −9.4% |
| Development land | 10.87 | 11.23 | +3.3% |
| Malaysia | 107.68 | 105.12 | −2.4% |
Value, Table III–IV.[1]
Sector change, H1 2026 vs H1 2025
Down (left)Up (right)
| Residential vol |
|
−7.7% |
| Residential val |
|
−4.6% |
| Commercial vol |
|
+0.9% |
| Commercial val |
|
−1.3% |
| Industrial vol |
|
−5.2% |
| Industrial val |
|
+3.8% |
| Agriculture vol |
|
−0.7% |
| Agriculture val |
|
−9.4% |
| Land volume |
|
+5.3% |
| Land value |
|
+3.3% |
Sector volume, H1 2025 vs H1 2026
H1 2025H1 2026
| Residential |
|
120,307110,998 |
| Agriculture |
|
37,28337,006 |
| Commercial |
|
21,26021,454 |
| Dev. land |
|
13,22013,918 |
| Industrial |
|
4,1483,932 |
Sector value, H1 2025 vs H1 2026
H1 2025H1 2026
| Residential |
|
49.37b47.11b |
| Commercial |
|
24.45b24.13b |
| Industrial |
|
14.25b14.78b |
| Dev. land |
|
10.87b11.23b |
| Agriculture |
|
8.63b7.82b |
Residential sector has slowed down
Terrace houses still lead residential volume at 40.9%, then high-rise 19.1%, vacant plots 16.9%, semi-D 7.7%, low-cost 6.6%, detached 6.4%.[1] The type mix did not suddenly change. Instead, the price mix is the story.
- Below RM300,000: 57,323 deals, down 10.2%.
- RM300,000 to RM500,000: 28,839, down 1.5%.
- RM500,000 to RM1 million: 18,357, down 9.4%.
- Above RM1 million: 6,479, down 6.6%.[1]
In particular, the slowdown is in the affordable market. The sub-RM300,000 range is “dominant” at 51.6% of residential and fell hardest.[1]
Johor, Selangor, WP Kuala Lumpur and Pulau Pinang still did about half of national residential volume.[1]
Price bands
| Price band | H1 2025 | H1 2026 | Change |
|---|---|---|---|
| Below RM300,000 | 63,847 | 57,323 | −10.2% |
| RM300,000 – RM500,000 | 29,269 | 28,839 | −1.5% |
| RM500,000 – RM1 million | 20,254 | 18,357 | −9.4% |
| Above RM1 million | 6,937 | 6,479 | −6.6% |
| Residential total | 120,307 | 110,998 | −7.7% |
Overview p. 8, Charts 9–12.[1]
Residential volume change by price band
Down (left)Up (right)
| Below RM300k |
|
−10.2% |
| RM300–500k |
|
−1.5% |
| RM500k–1m |
|
−9.4% |
| Above RM1m |
|
−6.6% |
Residential volume, H1 2025 vs H1 2026
H1 2025H1 2026
| Below RM300k |
|
63,84757,323 |
| RM300–500k |
|
29,26928,839 |
| RM500k–1m |
|
20,25418,357 |
| Above RM1m |
|
6,9376,479 |
House prices
House prices almost stopped rising. The Malaysian House Price Index for Q2 2026 (provisional) is 234.7 points, average RM506,317, up 0.9% year on year. All states were positive except Selangor and Perak. Perlis led at +7.0%, then Melaka +4.6%. Terraced and detached were +1.1%, high-rise +0.9%, semi-D unchanged.[1]
Use the revised series. The H1 2025 report printed Q2 2025 as 227.3 points and +0.7%. H1 2026 then revises Q2 2025 to 232.5 and +3.0%. On that revised series, annual house-price growth slowed from 3.0% to 0.9%. That is the weakest annual reading on that chart since 2022.[1][2]
MHPI annual change (selected)
| Perlis |
|
+7.0% |
| Melaka |
|
+4.6% |
| National |
|
+0.9% |
Leaders named in the report. Selangor and Perak were the only negative states.[1]
Industrial: fewer deals, more value = rising price
Industrial is the quality-over-quantity sector. Volume was 3,932, down 5.2%, while value was RM14.78 billion, up 3.8%. Terrace factory and warehouse was 34.1% of volume (1,339). Vacant industrial plots were 27.7% (1,088).[1]
Selangor did 32.9% of industrial volume (1,293), Johor 17.0% (669), Negeri Sembilan 7.9% (309).[1] Northern industrial was the bright pocket: volume +12.0%, value +24.1%. NAPIC ties the demand channel in the text to E&E, AI and data centres.[1]
Development land
Development land grew with a narrow geography. Volume rose 5.3% to 13,918 and value rose 3.3% to RM11.23 billion. Johor development-land value was +56.1%, Sarawak +71.0%, Sabah +133.8%, Kelantan volume +43.5%. In contrast, Selangor, Perak and Melaka development-land value fell hard.[1] “Land is strong” is a Johor and East Malaysia sentence, not a national one.
| Industrial | H1 2025 | H1 2026 | Change |
|---|---|---|---|
| Volume (deals) | 4,148 | 3,932 | −5.2% |
| Value (RM b) | 14.25 | 14.78 | +3.8% |
Industrial H1 2026 vs H1 2025
Down (left)Up (right)
| Volume |
|
−5.2% |
| Value |
|
+3.8% |
The market centres: overall decline
H1 2025’s volume engine was Selangor, Johor and Perak. However, in H1 2026 those three all fell. East Coast and East Malaysia were the only regions with both volume and value up. Even so, value is still a Central plus Southern story: 70.5% of national value share.[1]
Central
Central (KL, Selangor, Putrajaya): 42,665 deals, down 6.1%; RM43.41 billion, down 7.2%. That is 22.8% of national volume and 41.3% of national value. Selangor 31,714 deals, down 9.2%. WP KL 10,772, up 4.2% in volume but down 8.7% in value (fewer large commercial tickets than a year earlier). Putrajaya value was down 46.9%.[1]
Southern
Southern (Johor, Melaka, Negeri Sembilan): 45,956 deals, down 10.1%; RM30.73 billion, up 3.7%. The split is Johor: volume fell 11.5% to 28,238 while value rose 8.2% to RM23.43 billion. Residential volume in the state was down 15.1% (21,061 to 17,871), the single largest state-sector volume drop in the country. Offsetting that: Johor commercial value +25.8% and development-land value +56.1%. Johor is 61.4% of Southern volume and 76.2% of Southern value.[1]
Northern
Northern (Penang, Perak, Kedah, Perlis): 46,381 deals, down 7.8%; about RM16.36 billion, down 9.1%. Every Northern state fell in both volume and value. Perlis down 15.4% is the steepest state decline.[1]
East Coast
East Coast (Pahang, Terengganu, Kelantan): 33,652 deals, up 3.8%; RM6.74 billion, up 7.1%. Only Peninsular region with both up. Kelantan value +15.1% is the strongest East Coast value print, from a small base.[1]
East Malaysia
East Malaysia (Sabah, Sarawak, Labuan): 18,666 deals, up 10.2%; RM7.89 billion, up 13.1%. Strongest regional growth. Sabah volume +25.7%, and agriculture in Sabah jumped from 669 to 2,025 (+202.7%), the largest single state-sector swing in the report. Sarawak development-land value +71.0% and industrial value +51.2%. Labuan volume +12.6%. Table IV prints Labuan at RM156.77 billion — that is RM156.77 million.[1]
Who moved
Volume ranking is still Selangor, Johor, then Perak. KL overtook Penang. Pahang overtook Negeri Sembilan and Melaka. Penang is the only major state to lose a top-8 slot. Value ranking is Selangor RM28.31 billion, Johor RM23.43 billion, WP KL RM14.90 billion. NAPIC flags volume-up states as WP KL, Terengganu, Pahang, Kelantan, Sabah, Sarawak and WP Labuan.[1]
| Region | H1 2025 | H1 2026 | Vol |
|---|---|---|---|
| Central | 45,442 | 42,665 | −6.1% |
| Southern | 51,128 | 45,956 | −10.1% |
| Northern | 50,286 | 46,381 | −7.8% |
| East Coast | 32,433 | 33,652 | +3.8% |
| East Malaysia | 16,943 | 18,666 | +10.2% |
Volume, sum of Table III–IV states.[1]
| Region | H1 2025 RM b | H1 2026 RM b | Val |
|---|---|---|---|
| Central | 46.79 | 43.41 | −7.2% |
| Southern | 29.62 | 30.73 | +3.7% |
| Northern | 18.00 | 16.36 | −9.1% |
| East Coast | 6.29 | 6.74 | +7.1% |
| East Malaysia | 6.97 | 7.89 | +13.1% |
Value, sum of Table III–IV states.[1]
Regions, volume and value change
Down (left)Up (right)
| Central vol |
|
−6.1% |
| Central val |
|
−7.2% |
| Southern vol |
|
−10.1% |
| Southern val |
|
+3.7% |
| Northern vol |
|
−7.8% |
| Northern val |
|
−9.1% |
| East Coast vol |
|
+3.8% |
| East Coast val |
|
+7.1% |
| East Malaysia vol |
|
+10.2% |
| East Malaysia val |
|
+13.1% |
Only one price category grew
Across all property, not just houses, the above-RM1 million band is the only volume band that grew: 16,688 deals, up 2.2%. Every lower price range segment shrank. For example, RM0 to RM100,000 was down 9.6%. The RM500,000 to RM1 million slice was down 8.0%.[1]
For the residential segment, even the above-RM1 million houses fell 6.6%. So there is solid reason to think the all-property >RM1 million print is being carried by the non-residential market.[1]
All-property volume change by price band
Down (left)Up (right)
| RM0–100k |
|
−9.6% |
| RM100–200k |
|
−2.3% |
| RM200–300k |
|
−1.7% |
| RM300–400k |
|
−0.3% |
| RM400–500k |
|
−3.4% |
| RM500k–1m |
|
−8.0% |
| Above RM1m |
|
+2.2% |
| All-property band | H1 2025 | H1 2026 | Change |
|---|---|---|---|
| RM0 – 100,000 | 52,044 | 47,050 | −9.6% |
| RM100,001 – 200,000 | 32,615 | 31,852 | −2.3% |
| RM200,001 – 300,000 | 27,083 | 26,610 | −1.7% |
| RM300,001 – 400,000 | 21,619 | 21,557 | −0.3% |
| RM400,001 – 500,000 | 16,138 | 15,594 | −3.4% |
| RM500,001 – 1,000,000 | 30,403 | 27,969 | −8.0% |
| Above RM1 million | 16,330 | 16,688 | +2.2% |
| Malaysia | 196,232 | 187,320 | −4.5% |
Table I. Chart 5 groups below RM300,000 as 111,742 → 105,512 (−5.6%).[1]
Summary and takeaway
The report says industrial and development land have “strong resilience” via logistics, warehousing and e-commerce. OPR at 2.75% is the demand anchor.[4] Residential demand is expected to stay on affordable and at or below RM500,000. Budget 2026: SJKP RM20 billion, stamp duty holiday for first homes at or below RM500,000 until December 2027. The caveat is external shocks and affordability: oil prices and a possible rate hike by BNM (the US already hiked on 16 September 2026).[1][5]
Meanwhile, the below-RM500,000 and sub-RM300,000 categories’ volume fell. Therefore, the only all-property price band that grew is above RM1 million.[1]
For context, full-year 2025 was 416,413 transactions, down 1.0% versus 2024, value RM241.87 billion, up 4.1%. H2 2025 itself was 220,181 transactions, stronger than H1 2025. H1 2026 (187,320) is weaker than both halves of 2025.[3][1]
H1 2026 NAPIC report — top 7 moves
Down (left)Up (right)
| 1 Resi volume |
|
−7.7% |
| 120,307 → 110,998 | ||
| 2 Below RM300k |
|
−10.2% |
| 63,847 → 57,323 | ||
| 3 Southern vol |
|
−10.1% |
| 51,128 → 45,956 | ||
| 4 Northern vol |
|
−7.8% |
| 50,286 → 46,381 | ||
| 5 East Malaysia |
|
+10.2% |
| 16,943 → 18,666 | ||
| 6 Ind. value |
|
+3.8% |
| RM14.25b → RM14.78b | ||
| 7 Above RM1m |
|
+2.2% |
| 16,330 → 16,688 | ||
Rank 1 is the largest absolute deal drop. No starts, no overhang.[1]
| # | Change | H1 2025 → H1 2026 | % |
|---|---|---|---|
| 1 | Residential volume | 120,307 → 110,998 | −7.7% |
| 2 | Below RM300,000 (residential) | 63,847 → 57,323 | −10.2% |
| 3 | Southern volume | 51,128 → 45,956 | −10.1% |
| 4 | Northern volume | 50,286 → 46,381 | −7.8% |
| 5 | East Malaysia volume | 16,943 → 18,666 | +10.2% |
| 6 | Industrial value | RM14.25b → RM14.78b | +3.8% |
| 7 | Above RM1m (all-property) | 16,330 → 16,688 | +2.2% |
Seven moves still in this note. No eighth row.[1]
Generally, H1 2026 is a housing-led (the largest real estate segment) volume decline. As a result, H1 2026 is a weaker period since 2022.
Sources
[1] NAPIC, Laporan Pasaran Harta H1 2026 (PDF), 9 September 2026. Listing: Pasaran Harta Separuh Pertama / Wilayah.
[2] NAPIC, Laporan Pasaran Harta H1 2025 (cross-check). Archive: H1 / wilayah reports.
[3] NAPIC, Laporan Pasaran Harta 2025 (full year PDF). Listing: Laporan tahunan. Context only.
[4] Bank Negara Malaysia, OPR decisions (2.75% as of 3 September 2026) and monetary stability (GDP Q2 2026 6.0%).
[5] Federal Reserve, FOMC statement, 16 September 2026 (federal funds target raised 1/4 point to 3-3/4 to 4 percent).



Leave a Reply